9 Histograms
This chapter describes the functions for creating and using histograms provided by the Science Collection. Histograms provide a convenient way of summarizing the distribution of a set of data. A histogram contains a vector of bins that count the number of events falling within a given range. The bins of a histogram can be used to record both integer and non-integer distributions.
The ranges can be either continuous or discrete over a range. For continuous ranges, the width of these ranges can be either fixed or arbitrary. Also, for continuous ranges, both one- and two-dimensional histograms are supported.
9.1 Histograms
The histogram functions described in this section are defined in the "histogram.rkt" file in the Science Collection and are made available using the form:
Returns true, #t, if x is a histogram and false, #f, otherwise.
9.1.1 Creating Histograms
Returns a new, empty histogram with n bins. The n + 1 range entries are initialized to provide n uniform width bins from x-min to x-max.
9.1.2 Updating and Accessing Histogram Elements
Returns the number of bins in the histogram h.
Returns a vector of ranges for the histogram h. The length of the vector is equal to the number of bins in h plus one.
Sets the ranges for the histogram h according to the given ranges. The length of the ranges vector must equal the number of bins in h plus one. The bins in h are also reset.
Sets the ranges for the histogram h uniformly from x-min to x-max. The bins in h are also reset.
Returns the vector of bins for the histogram h.
Increments the bin in the histogram h containing x. The bin value is incremented by one.
Increments the bin in the histogram h containing x by the specified weight. Since in this implementation bin values are non-megative, the weight must be non-negative.
Returns the contents of the ith bin of the histogram h.
Returns the lower and upper range limits for the ith bin of the histogram h. The lower and upper range limits are returned as multiple values.
9.1.3 Histogram Statistics
Returns the maximum bin value for the histogram h. Since in this implementation bin values are non-negative, the maximum value is also non-negative.
Returns the minimum bin value for the histogram h. Since in this implementation bin values are non-negative, the minimum value is also non-negative.
Returns the sum of the data in the histogram h. Since in this implementation bin values are non-negative, the sum is also non-negative.
Returns the mean of the data in the histogram h. Since in this implementation bin values are non-negative, the mean is also non-negative.
Returns the standard deviation of the data in the histogram h.
9.1.4 Histogram Graphics
The histogram graphics functions are defined in the file "histogram-graphics.rkt" in the Science Collection and are made available using the following form:
This function returns a plot of the histogram h with the specified title. If title is not specified, "Histogram" is used. The plot is scaled to the maximum bin value. The plot is produced by the histogram plotting extension to the plot collection provided with Racket.
This function returns a plot of the histogram h with the specified title. If title is not specified, "Histogram" is used. The plot is scaled to the sum of the bin values. It is most useful for a small number of bins—generally, twn or less. The plot is produced by the histogram plotting extension to the plot collection provided with Racket.
9.1.5 Histogram Examples
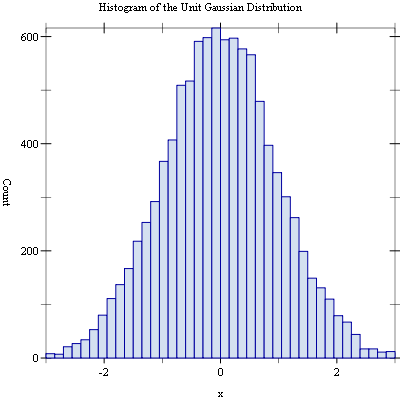
Example: Histogram of random variates from the unit Gaussian (normal) distribution.
The following figure shows the resulting histogram:
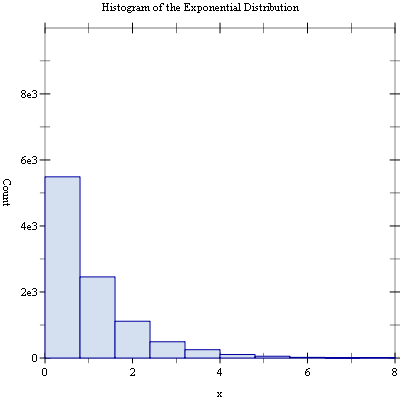
Example: Scaled histogram of random variates from the exponential distribution with mean 1.0.
The following figure shows the resulting histogram:
9.2 2D Histograms
The 2D histogram functions described in this section are defined in the "histogram-2d.rkt" file in the Science Collection and are made available using the form:
Returns true, #t, if x is a 2D histogram and false, #f, otherwise.
9.2.1 Creating 2D Histograms
Returns a new, empty 2D histogram with
nx bins in the x direction and
ny bins in the y direction and
nx + 1
range entries in the x direction and
ny + 1
range entries in the y direction. The range entries must be set with a subsequent call to
set-histogram-2d-ranges! or
set-histogram-2d-ranges-uniform!.
Returns a new, empty 2D histogram with nx bins in the x direction and ny bins in the y direction. The nx + 1 range entries in the x direction are initialized to provide nx uniform width bins from x-min to x-max. The ny + 1 range entries in the y direction are initialized to provide ny uniform width bins from y-min to y-max.
9.2.2 Updating and Accessing 2D Histogram Elements
Returns the number of bins in the x direction in the 2D histogram h.
Returns the number of bins in the y direction in the 2D histogram h.
Returns a vector of ranges in the x direction for the 2D histogram h. The length of the vector is equal to the number of bins in the x direction in h plus one.
Returns a vector of ranges in the y direction for the 2D histogram h. The length of the vector is equal to the number of bins in the y direction in h plus one.
Sets the ranges for the 2D histogram h according to the given x-ranges and y-ranges. The length of the x-ranges vector must equal the number of bins in the x direction in h plus one. The length of the y-ranges vector must equal the number of bins in the y direction in h plus one. The bins in h are also reset.
Sets the ranges for the 2D histogram h uniformly from x-min to x-max in the x direction and uniformly from y-min to y-max in the y direction. The bins in h are also reset.
Returns the vector of bins for the 2D histogram h. The length of the vector is nx * ny, where nx is the number of bins in the x direction in h and ny is the number of bins in the y direction in h. The (i, j)th index is computed as (i * ny) + j.
Increments the bin in the 2D histogram h containing (x, y). The bin value is incremented by one.
Increments the bin in the 2D histogram h containing (x, y) by the specified weight. Since in this implementation bin values are non-megative, the weight must be non-negative.
Returns the contents of the (i, j)th bin of the histogram h.
|
| h : histogram? |
| | i | | : | | | (and/c exact-non-negative-integer? | | (</c (histogram-nx h))) |
|
|
| | j | | : | | | (and/c exact-non-negative-integer? | | (</c (histogram-ny h))) |
|
|
Returns the lower and upper range limits in the x direction for the (i, j)th bin of the histogram h. The lower and upper range limits are returned as multiple values.
|
| h : histogram? |
| | i | | : | | | (and/c exact-non-negative-integer? | | (</c (histogram-nx h))) |
|
|
| | j | | : | | | (and/c exact-non-negative-integer? | | (</c (histogram-ny h))) |
|
|
Returns the lower and upper range limits in the y direction for the (i, j)th bin of the histogram h. The lower and upper range limits are returned as multiple values.
9.2.3 2D Histogram Statistics
Returns the maximum bin value for the 2D histogram h. Since in this implementation bin values are non-negative, the maximum value is also non-negative.
Returns the minimum bin value for the histogram h. Since in this implementation bin values are non-negative, the minimum value is also non-negative.
Returns the sum of the data in the 2D histogram h. Since in this implementation bin values are non-negative, the sum is also non-negative.
Returns the mean of the data in the x direction in the 2D histogram h. Since in this implementation bin values are non-negative, the mean is also non-negative.
Returns the mean of the data in the y direction in the 2D histogram h. Since in this implementation bin values are non-negative, the mean is also non-negative.
Returns the standard deviation of the data in the x direction in the 2D histogram h.
Returns the standard deviation of the data in the y direction in the 2D histogram h.
Returns the covariance of the data in the 2D histogram h.
9.2.4 2D Histogram Graphics
The 2D histogram graphics functions are defined in the file "histogram-2d-graphics.rkt" in the Science Collection and are made available using the following form:
This function returns a plot of the 2D histogram h with the specified title. If title is not specified, "Histogram" is used. The plot is scaled to the maximum bin value. The plot is produced by the histogram plotting extension to the plot collection provided with Racket.
9.2.5 2D Histogram Examples
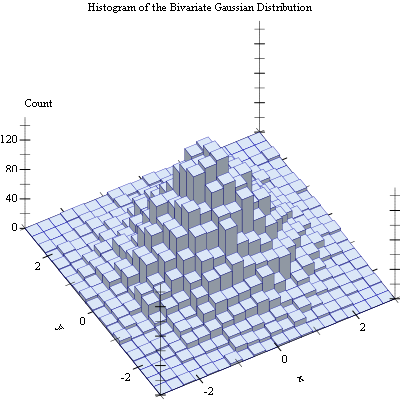
Example: 2D histogram of random variates from the bivariate Gaussian distribution with standard deviation 1.0 in both the x and y direction and correlation coefficient 0.0.
The following figure shows the resulting histogram:
9.3 Discrete Histograms
The discrete histogram functions described in this section are defined in the "discrete-histogram.rkt" file in the Science Collection and are made available using the form:
Returns true, #t, if x is a discrete histogram and false, #f, otherwise.
9.3.1 Creating Discrete Histograms
Returns a new, empty discrete histogram with range
n1 to
n2. If
dynamic? is #t or
make-discrete-histogram is called with no arguments, the resulting discrete histogram will grow dynamically to accomodate subsequent data points.
9.3.2 Updating and Accessing Discrete Histogram Elements
Returns the lower range of the discrete histogram h.
Returns the upper range of the discrete histogram h.
Returns true, #t, if the discrete histogram h is dynamic and false, #f, otherwise.
Returns the vector of bins for the discrete histogram h.
Increments the bin in the discrete histogram h containing i. The bin value is incremented by one.
Increments the bin in the discrete histogram h containing i by the specified weight. Since in this implementation bin values are non-megative, the weight must be non-negative.
Returns the contents of the bin of the discrete histogram h containing i.
9.3.3 Discrete Histogram Statistics
Returns the maximum bin value for the discrete histogram h. Since in this implementation bin values are non-negative, the maximum value is also non-negative.
Returns the minimum bin value for the discrete histogram h. Since in this implementation bin values are non-negative, the minimum value is also non-negative.
Returns the sum of the data in the discrete histogram h. Since in this implementation bin values are non-negative, the sum is also non-negative.
Returns the mean of the data in the discrete histogram h. Since in this implementation bin values are non-negative, the mean is also non-negative.
Returns the standard deviation of the data in the discrete histogram h.
9.3.4 Discrete Histogram Graphics
The discrete histogram graphics functions are defined in the file "discrete-histogram-graphics.rkt" in the Science Collection and are made available using the following form:
This function returns a plot of the discrete histogram h with the specified title. If title is not specified, "Histogram" is used. The plot is scaled to the maximum bin value. The plot is produced by the histogram plotting extension to the plot collection provided with Racket.
This function returns a plot of the discrete histogram h with the specified title. If title is not specified, "Histogram" is used. The plot is scaled to the sum of the bin values. It is most useful for a small number of bins—generally, twn or less. The plot is produced by the histogram plotting extension to the plot collection provided with Racket.
9.3.5 Discrete Histogram Examples
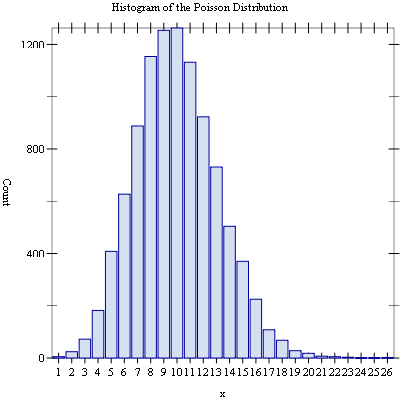
Example: Discrete histogram of random variates from the Poisson distribution with mean 10.0.
The following figure shows the resulting histogram:
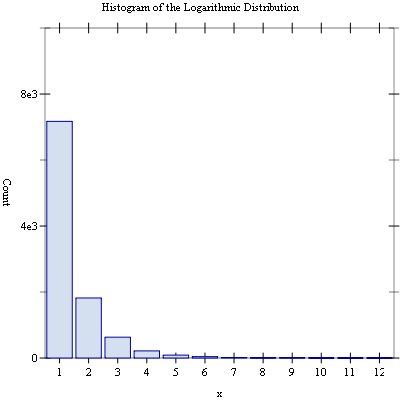
Example: Scaled discrete histogram of random variates from the logarithmic distribution with probability 0.5.
The following figure shows the resulting histogram: