Markets
| (require (planet jeeve/markets)) |
This basic library provided client web service and graphics to follow financial markets evolution.
1 Values
(market-value stock-symbol) → number? stock-symbol : string?
Returns the value of quote (in live). Example about CAC40 indice:
> (market-value "^FCHI")
Returns -1 if stock symbol not found or web service connection failed.
You can find a list of US stock symbols here: Stock symbols
2 Graphics
(market-graph stock-symbol) → any/c stock-symbol : string?
Graphic evolution of one quote market. Default time scale is one hour (3600 s).
> (market-graph "^DJA")
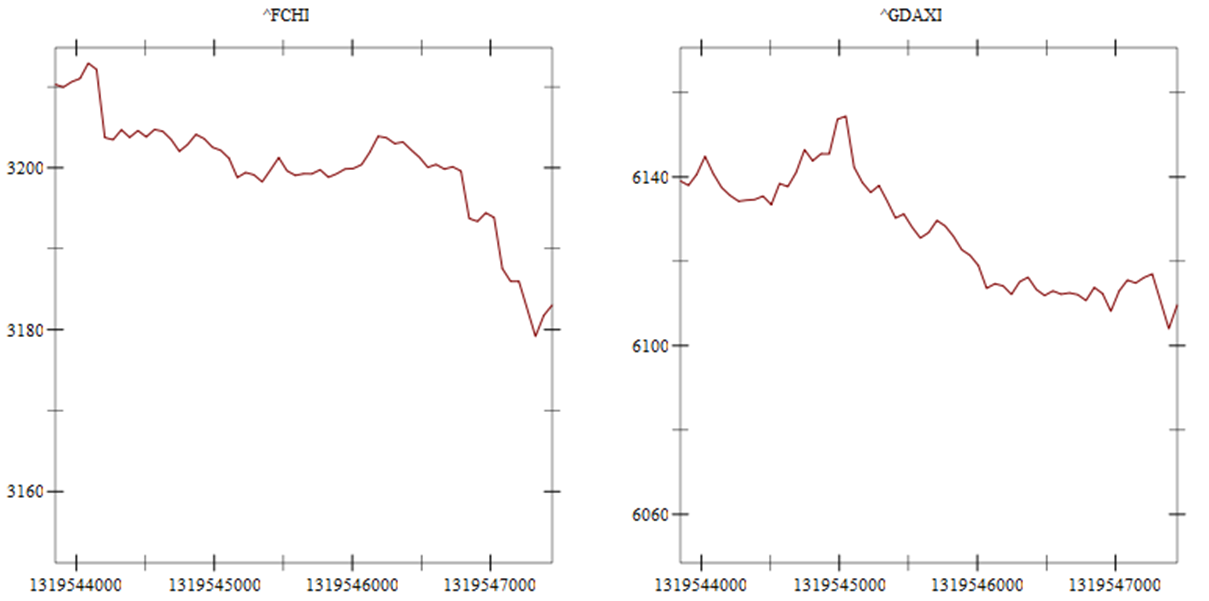
(markets-dashboard stock-symbols) → any/c stock-symbols : (listof (listof string?))
This function displays graphic quotes in rows and columns disposition. Each sublist is a row.
> (markets-dashboard '(("^FCHI" "^GDAXI") ("^DJA" "^NYA")))
You can parameterize axis scale:
(parameterize ([delta-x (* 2 3600)] ; 2 hours in x axis [delta-y 0.01]) ; 1% in y axis (markets-dashboard '(("^FCHI" "^GDAXI"))))