gnuplot.plt
1 Overview
This library provides a wrapper interface to gnuplot. Using the library, mzscheme programs can spawn inferior gnuplot processes and plot data to windows or hardcopy with a programmatic interface.
The library assumes gnuplot version 4.x (tested with 4.2.3).
1.1 License
(C) Copyright 2008 Dimitris Vyzovitis <vyzo at media.mit.edu>
gnuplot.plt is free software: you can redistribute it and/or modify it under the terms of the GNU General Public License as published by the Free Software Foundation, either version 3 of the License, or (at your option) any later version.
gnuplot.plt is distributed in the hope that it will be useful, but WITHOUT ANY WARRANTY; without even the implied warranty of MERCHANTABILITY or FITNESS FOR A PARTICULAR PURPOSE. See the GNU General Public License for more details.
You should have received a copy of the GNU General Public License along with gnuplot.plt. If not, see <http://www.gnu.org/licenses/>.
2 API
2.1 Gnuplot processes
gnuplot-spawn spawns a gnuplot processes, using (gnuplot-program).
When read? is #t then output from gnuplot can be collected through the port accessible with gnuplot-input-port. gnuplot-writeln can be used to write directly to the process’s input port.
The processes is garbage collected when unreachable, but can be explicitly killed with gnuplot-kill
| ||
|
The gnuplot executable.
Defaults to "gnuplot" under unix/macosx and "pgnuplot.exe" under windows.
2.2 Data sources
| |||||||||||||||||||||||||||||||||||
| data : list? | |||||||||||||||||||||||||||||||||||
| fname : path-string? = #f | |||||||||||||||||||||||||||||||||||
| comments : list? = #f | |||||||||||||||||||||||||||||||||||
| tmpdir : path-string? = #f | |||||||||||||||||||||||||||||||||||
| bin? : bool? = #f |
Creates a data source using data, which must be a list of lists of numbers, written to a temporary file when fname is #f.
When bin? is #f files are written in ascii, optionally prepending comments from comments which when supplied must be a list of strings. When bin? is #t data is written in binary form, following gnuplot’s binary matrix file format.
Temporary files are automatically deleted when the data sources become unreachable.
| (gnuplot-data/file fname [bin?]) → gnuplot-data? |
| fname : path-string? |
| bin? : bool? = #f |
Create a data source using an existing file.
| (gnuplot-data? o) → bool? |
| o : any |
#t when o is a gnuplot data source.
2.3 Plotting
Plotting is controlled using a simple translation scheme that maps items to gnuplot’s idiosyncratic syntax, with the following grammar:
| source-item | = | (item <data> <item> ...) | ||
| sequence-item | = | (seq <item> ...) | ||
| | | (seq: <item> ...) | |||
| | | (seq* <item> ...) | |||
| range-item | = | () | ||
| | | (<number>/#f <number>/#f) | |||
| | | (<symbol> <number>/#f <number>/#f) | |||
| | | <string> | |||
| param-item | = | (= <symbol> <item>) | ||
| path-item | = | (path <path-string>) | ||
| str-item | = | (str <string>) | ||
| empty-item | = | #f | ||
| any-item | = | <any> |
source-item – is a plot directive.
sequence-item – is mapped to a sequence of items, joined with ",", ":", or " " respectively.
range-item – is a plot range.
param-item – is a parametric expression.
path-item – is a single quoted string, while a str-item is a double-quoted string.
empty-item – is translated to an empty string
Any other object is translated to its printed representation using format.
| (gnuplot-item data [options]) → item? |
| data : gnuplot-data? |
| options : plot-item? = null |
Create a plot item, using data as the data source, prepended to options.
| ||||
| ||||
|
Basic plotting functions.
range, when present, must be a list of range items.
| |||||||||||||||||||||
| gplot : gnuplot? | |||||||||||||||||||||
| layout : list? = null | |||||||||||||||||||||
| plot : procedure? |
Performs a multiplot, with layout a list of items, by calling the plot procedures in order with gplot as argument.
| ||||||||||||||||||||||||||||
| gplot : gnuplot? | ||||||||||||||||||||||||||||
| fname : path-string? | ||||||||||||||||||||||||||||
| plot : procedure? = gnuplot-replot | ||||||||||||||||||||||||||||
| term : item? = '(postscript color) |
Plots with output to file.
| |||
| |||
| |||
|
Modify plot options.
3 Example
The images were created with gnuplot-hardcopy and converted to png using imagemagick’s convert utility
Here we use a simple iterative example to illustrate how to use the library, assuming familiarity with gnuplot.
First, let’s create a gnuplot process and a simple data source:
| (define gplot (gnuplot-spawn)) |
| (define sin+cos |
| (build-list 200 |
| (lambda (x) |
| (let ((x (/ (* x pi) 100))) |
| (list x (sin x) (cos x)))))) |
| (define mydata (gnuplot-data sin+cos)) |
Here, mydata is a data source that contains 200 samples from the sin and cos functions.
We can split the two functions, creating two plot items:
| (define mysin |
| (gnuplot-item mydata '(using (seq: 1 2) title (str "sin(x)") with line 1))) |
| (define mycos |
| (gnuplot-item mydata '(using (seq: 1 3) title (str "cos(x)") with line 2))) |
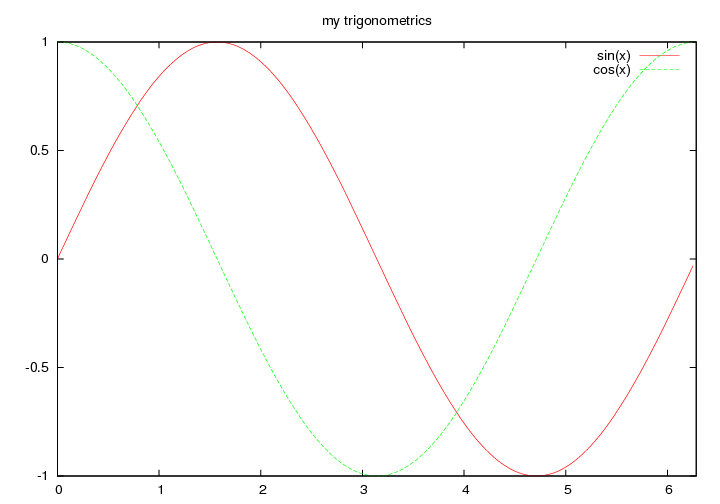
Now, to plot the two functions together:
| (gnuplot-set gplot '(title (str "my trigonometrics"))) |
| (gnuplot-plot gplot #:range `((#f ,(* 2 pi)) ()) mysin mycos) |
We can take a hardcopy of the plot using gnuplot-hardcopy:
(gnuplot-hardcopy gplot "/tmp/trig.eps")
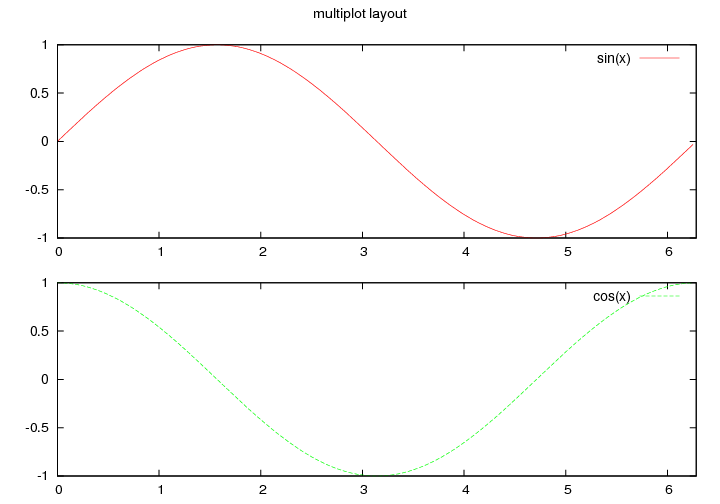
We can create a multiplot layout using gnuplot-multiplot:
| (define (plot-sin gplot) |
| (gnuplot-plot gplot #:range `((#f ,(* 2 pi)) ()) mysin)) |
| (define (plot-cos gplot) |
| (gnuplot-plot gplot #:range `((#f ,(* 2 pi)) ()) mycos)) |
| (gnuplot-reset gplot) ; reset plotting |
| (gnuplot-multiplot gplot |
| #:layout '(layout (seq 2 1) title (str "multiplot layout")) |
| plot-sin plot-cos) |
Finally, to take a hard copy of the multiplot layout:
| (gnuplot-hardcopy gplot "/tmp/multi.eps" |
| (lambda (gplot) |
| (gnuplot-multiplot gplot |
| #:layout '(layout (seq 2 1) title (str "multiplot layout")) |
| plot-sin plot-cos))) |