8 Data Collection
The purpose of most simulation models is to collect data to analyze to gain insights into the system being simulated. In the PLT Scheme Simulation Collection, (numeric) data that is subject to automatic data collection is stored in variable structure instances (i.e. variables).
Data for a variable may either be collected in a time-dependent manner, specified using the accumulate macro, or in a time-independent manner, specified using the tally macro.
Currently, both statistical data and history data may be automatically collected for a variable. (Both may in turn be either time-dependent or time-independent.) History data allows more more sophisticated analysis to be performed on the data using other analysis tool (e.g. the statistics routines in the PLT Scheme Science Collection). Also, a function to plot history data is provided.
8.1 Variables
A variable represents a numeric variable in the model for which data can automatically be collected as specified by the model developer.
8.1.1 The variable Structure
| (struct variable (initial-value |
| value |
| time-last-synchronized |
| statistics |
| history |
| continuous? |
| state-index |
| get-monitors |
| set-monitors)) |
| initial-value : (or/c (symbols uninitialized) real?) |
| value : (or/c (symbols uninitialized) real?) |
| time-last-synchronized : real? |
| statistics : (or/c statistics? false/c) |
| history : (or/c history? false/c) |
| continuous? : boolean? |
| state-index : (or/c (and/c exact? integer? (=/c -1)) |
| exact-nonnegative-integer?) |
| get-monitors : list? |
| set-monitors : list? |
Instances of the variable structure represent variable in the simulation model. The variable structure has the following fields:
initial-value – The initial value of the variable. This is not currently being used, but may be used in the future to reset variables.
value – The current value of the variable.
time-last-synchronized – The time the variable was last synchronized. This is used internally to implement time-dependent data collectors.
statistics – The statistics data collector for the variable or #f.
history – The history data collector for the variable or #f.
continuous? – True, #t, if the variable is a continuous variable or false, #f, otherwise.
state-index – The index for the variable in the state vector or -1 if the variable is not a continuous variable or is not currently allocated to the state vector (i.e., the process owning the continuous variable is not currently in a work/continuously). (See Chapter 10 Continuous Simulation Models)
get-monitors – A list of get monitors for the variable.
set-monitors – A list of set monitors for the variable.
| (make-variable [initial-value]) → variable? | ||||||||||||
|
Returns a newly created variable with the specified initial-value. Of initial-value is not provides, 'uninitialized is used indicating that the variable has no value.
By default, all variables accumulate statistics on their values. To turn this off, set the statistics field to #f using (set-variable-statistics! variable #f).
To create continuous variables, see Chapter 10 Continuous Simulation Models.
8.1.2 Tally and Accumulate
The tally and accumulate macros specify the automatic data collection for a variable.
| (tally (variable-statistics variable)) |
| (tally (variable-history variable)) |
Specifies time-independent data collection for the specified variable. variable-statistics specifies that statistics are to be tallied for variable. variable-history specifies that a history is to be tallied for variable.
Whenever the value of variable is changed, any tallied data collectors are updated with the new value.
| (accumulate (variable-statistics variable)) |
| (accumulate (variable-history variable)) |
Specified time-dependent data collection for the specified variable. variable-statistics specifies that statistics are to be accumulated for variable. variable-history specifies that a history is to be accumulated for variable.
Whenever the value of variable is accessed or before its value is changed, any accumulated data collectors are synchronized with the current value over the time since it was last synchronized.
8.1.3 Variable Statistics
| (struct statistics (time-dependent? |
| minimum |
| maximum |
| n |
| sum |
| sum-or-squares)) |
| time-dependent? : boolean? |
| minimum : real? |
| maximum : real? |
| n : real? |
| sum : real? |
| sum-of-squares : (>=/c 0.0) |
The statistics structure maintains statistics for a variable.
time-dependent? – True, #t, if the statistics are being accumulated (i.e., are time-dependent) or false, #f, if the statistics are being tallied (i.e., are time-independent).
minimum – The minimum value the variable has had. (Initial value is +inf.0).
maximum – The maximum value the variable has had. (Initial value is -inf.0).
n – See table below.
sum – See table below.
schemefont{sum-of-squares} – See table below.
The following table shows the statistics that are gathered and how they are computed for both tally and accumulate.
Statistic | tally | accumulate |
n | number of samples of X | timeC - time0 |
sum | Σ X | Σ X × (timeC - timeL) |
mean | sum/n | sum/n |
sum-of-squares | Σ X2 | Σ X2 × (timeC - timeL) |
mean-square | sum-of-squares/n | sum-of-squares/n |
variance | mean-square - mean2 | mean-square - mean2 |
standard-deviation | variance½ | variance½ |
minimum | minimum X for all X | minimum X for all X |
maximum | maximum X for all X | maximum X for all X |
where,
timeC = current simulation time
timeL = simulation time the variable was set to its current value
time0 = simulation time the variable was created
X = variable value
8.1.4 Variable History
| (struct history (time-dependent? |
| initial-time |
| n |
| values |
| last-cell-value |
| durations |
| last-duration_cell)) |
| time-dependent? : boolean? |
| initial-time : real? |
| n : exact-nonnegative-integer? |
| values : mlist? |
| last-value-cell : (or/c mpair? false/c) |
| durations : mlist? |
| last-duration_cell : (or/c mpair? false/c) |
The history structure maintains a history of the values for a variable. For accumulated histories (i.e., those specified using the accumulate macro), the durations for each value are also computed.
time-dependent? – True, #t, if the history is being accumulated (i.e., is time-dependent) or false, #f, if the history is being tallied (i.e., is time-independent).
initial-time – For a time dependent history, the (simulated) time the history was created.
n – The number of entries in the history.
values – A mutable list of values for the history.
last-value-cell – The last cell in values or #f if values is empty. (used to efficiently append to values.)
durations – For accumulated histories, a mutable list of durations for the history. (Not used for tallied histories.)
last-value-cell – The last cell in durations or #f if values is empty. (Used to efficiently append to durations.)
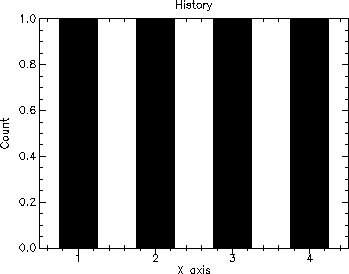
8.1.5 History Graphics
| (history-plot history [title]) → any |
| history : history? |
| title : string? = "History" |
Plots history using the specified title. The string "History" is used if title is not specified.
8.1.6 Variable Monitors
Variable monitors are discussed in Chapter 9 Monitors.
8.2 Example – Tally and Accumulate Example
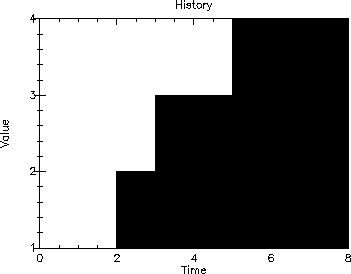
This example show how the tally and accumulate macros work. Two variables are created: tallied and accumulated. Statistics and history data are collected for each – using tally for the variable tallied and accumulate for the variable accumulated. The process test-process iterates through a list of values and durations, setting each of the variables to the specified value for the specified duration of time. Representative statistice, n, sum, and mean, are printed and the histories plotted for each of the variables.
| #lang scheme/base |
| ; Test Tally and Accumulate |
| (require (planet williams/simulation/simulation-with-graphics)) |
| (define tallied #f) |
| (define accumulated #f) |
| (define-process (test-process value-duration-list) |
| (let loop ((vdl value-duration-list)) |
| (when (not (null? vdl)) |
| (let ((value (caar vdl)) |
| (duration (cadar vdl))) |
| (set-variable-value! tallied value) |
| (set-variable-value! accumulated value) |
| (wait duration) |
| (loop (cdr vdl)))))) |
| (define (main value-duration-list) |
| (with-new-simulation-environment |
| (set! tallied (make-variable)) |
| (tally (variable-statistics tallied)) |
| (tally (variable-history tallied)) |
| (set! accumulated (make-variable)) |
| (accumulate (variable-statistics accumulated)) |
| (accumulate (variable-history accumulated)) |
| (schedule (at 0.0) (test-process value-duration-list)) |
| (start-simulation) |
| (printf "--- Test Tally and Accumulate ---~n") |
| (printf "~n--- Tally ---~n") |
| (printf "N = ~a~n" (variable-n tallied)) |
| (printf "Sum = ~a~n" (variable-sum tallied)) |
| (printf "Mean = ~a~n" (variable-mean tallied)) |
| (write-special (history-plot (variable-history tallied))) |
| (newline) |
| (printf "~n--- Accumulate ---~n") |
| (printf "N = ~a~n" (variable-n accumulated)) |
| (printf "Sum = ~a~n" (variable-sum accumulated)) |
| (printf "Mean = ~a~n" (variable-mean accumulated)) |
| (write-special (history-plot (variable-history accumulated))) |
| (newline))) |
| (main '((1 2)(2 1)(3 2)(4 3))) |
Here are the results of running the program for the following value/duration pairs: ((1 2) (2 1) (3 2) (4 3)). That is, each variable will have a value of 1 for 2 units of time (fromr time 0 to time 2), a value of 2 for 1 unit of time (from time 2 to time 3), a value of 3 for 2 units of time (from time 3 to time 5), and a value of 4 for 3 units of time (from time 5 to time 8). The simulation ends at time 8.
The following is the resulting output.
| --- Test Tally and Accumulate --- |
| --- Tally --- |
| N = 4 |
| Sum = 10.0 |
| Mean = 2.5 |
| --- Accumulate --- |
| N = 8.0 |
| Sum = 22.0 |
| Mean = 2.75 |
8.3 Example – Data Collection
The examples in previous chapters (Examples 0, 1, and 2) relied on pritf statements to print the output of the simulation model. This was sufficient to show how the models worked, byt would be impractical for large models. This example is the same simulation model as Example 2 from Chapter 7 Resources (using with-resource instead of the individual calls to request and relinquish), but uses automatic data collection to collect data.
No explicit variables are needed for this example since resources already provide variables for their satisfied and queue fields – since they are, in turn, implemented using sets. (See Chapter ?? Sets.)
Note that the statements:
| (accumulate (variable-statistics |
| (resource-queue-variable-n attendant))) |
| (accumulate (variable-statistics |
| (resource-satisfied-variable-n attendant))) |
are not required since statistics are accumulated for any variable by default. [Although it would work the same if one or both were included.]
| scheme/base |
| ; Example 3 - Data Collection |
| (require (planet williams/simulation/simulation-with-graphics)) |
| (require (planet williams/science/random-distributions)) |
| (define n-attendants 2) |
| (define attendant #f) |
| (define-process (generator n) |
| (do ((i 0 (+ i 1))) |
| ((= i n) (void)) |
| (wait (random-exponential 4.0)) |
| (schedule now (customer i)))) |
| (define-process (customer i) |
| (with-resource (attendant) |
| (work (random-flat 2.0 10.0)))) |
| (define (run-simulation n) |
| (with-new-simulation-environment |
| (set! attendant (make-resource n-attendants)) |
| (schedule (at 0.0) (generator n)) |
| (accumulate (variable-history |
| (resource-queue-variable-n attendant))) |
| (start-simulation) |
| (printf "--- Example 3 - Data Collection ---~n") |
| (printf "Maximum queue length = ~a~n" |
| (variable-maximum |
| (resource-queue-variable-n attendant))) |
| (printf "Average queue length = ~a~n" |
| (variable-mean |
| (resource-queue-variable-n attendant))) |
| (printf "Variance = ~a~n" |
| (variable-variance |
| (resource-queue-variable-n attendant))) |
| (printf "Utilization = ~a~n" |
| (variable-mean |
| (resource-satisfied-variable-n attendant))) |
| (printf "Variance = ~a~n" |
| (variable-variance |
| (resource-satisfied-variable-n attendant))) |
| (printf "~a~n" |
| (history-plot (variable-history |
| (resource-queue-variable-n attendant)))))) |
| (run-simulation 1000) |
The following is the resulting output.
| --- Example 3 - Data Collection --- |
| Maximum queue length = 8 |
| Average queue length = 0.9120534884951139 |
| Variance = 2.2420855874934826 |
| Utilization = 1.4320511974417858 |
| Variance = 0.5885107114317054 |
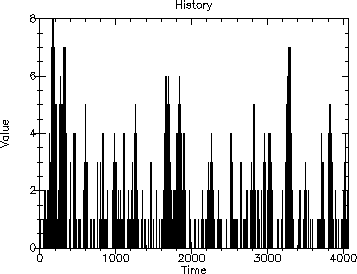
This is the first useful example we’ve shown in the since that we simulate enough customers to be meaningful and provide statistical output of the simulation.
A few things to note here:
We use the with-rosource form here to request and relinquish the attendant. This is generally the easiest way to use a resource.
The plot produced by history-plot can be printed. This works when DrScheme is used to execute the simulation model.
8.4 Data Collection Across Multiple Simulation Runs
Even as simplisting as our example simulation model is, it is still useful in ellustrating some advanced data collection techniques. In particular, in this section we will show how to collect statistics across multiple simulation runs.
8.4.1 Open Loop Processing
Open loop processing is a technique where a resource is considered to have an infinite number of units available for allocation. That is, no process will ever block waiting for such a resource. Statistics on the demand for such resources can be collected by looking at the resources-satistied-variable-n variable. Typically, this is done in a Monte Carlo fashion across multiple simulation rins.
In the simulation collection, we denote an open-loop resource by specifying an infinite number of units when the resource is created. In PLT Scheme, +inf.0 denotes positive infinity and is used in specifying an open-loop resource.
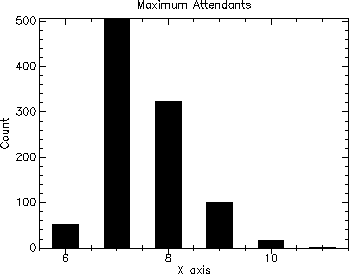
8.4.2 Example – Open Loop Processing
This example collects statistics on the maximum number of attendants required in the system (a measure of demand) when there is no blocking.
There is an outer simulation environment that exists solely for data collection and a variable max-attendants to gather statistics on the maximum number of attendants required. Note that these statistics must be tallied at this level because (simulated) time does not exist across multiple simulation runs.
The inner loop created a new simulation environment for each simulation run. This ensures that each run is properly initialized. It is in this inner loop that the attendant resource is created with an infinite number of units using (make-resource +inf.0). When the simulation in the inner loop terminates, the max-attendants variable (in the outer loop) is updated with the maximum number of attendants from the simulation. This is done with:
| (set-variable-value! max-attendants |
| (variable-maximum |
| (resource-satisfied-variable-n attendant))) |
Finally, the statistics and histogram of the maximum attendants accross all of the simulation runs is printed.
| #lang scheme/base |
| ; Open Loop Example |
| (require (planet williams/simulation/simulation-with-graphics)) |
| (require (planet williams/science/random-distributions)) |
| (define attendant #f) |
| (define (generator n) |
| (do ((i 0 (+ i 1))) |
| ((= i n) (void)) |
| (wait (random-exponential 4.0)) |
| (schedule now (customer i)))) |
| (define-process (customer i) |
| (with-resource (attendant) |
| (wait/work (random-flat 2.0 10.0)))) |
| (define (run-simulation n1 n2) |
| (with-new-simulation-environment |
| (let ((max-attendants (make-variable))) |
| (tally (variable-statistics max-attendants)) |
| (tally (variable-history max-attendants)) |
| (do ((i 1 (+ i 1))) |
| ((> i n1) (void)) |
| (with-new-simulation-environment |
| (set! attendant (make-resource +inf.0)) |
| (schedule (at 0.0) (generator n2)) |
| (start-simulation) |
| (set-variable-value! max-attendants |
| (variable-maximum |
| (resource-satisfied-variable-n attendant))))) |
| (printf "--- Open Loop Example ---~n") |
| (printf "Number of experiments = ~a~n" |
| (variable-n max-attendants)) |
| (printf "Minimum maximum attendants = ~a~n" |
| (variable-minimum max-attendants)) |
| (printf "Maximum maximum attendants = ~a~n" |
| (variable-maximum max-attendants)) |
| (printf "Mean maximum attendants = ~a~n" |
| (variable-mean max-attendants)) |
| (printf "Variance = ~a~n" |
| (variable-variance max-attendants)) |
| (write-special |
| (history-plot (variable-history max-attendants) |
| "Maximum Attendants")) |
| (newline)))) |
| (run-simulation 1000 1000) |
The following shows the output of the simulation for 1000 runs of 1000 customers each.
| --- Open Loop Example --- |
| Number of experiments = 1000 |
| Minimum maximum attendants = 6 |
| Maximum maximum attendants = 11 |
| Mean maximum attendants = 7.525 |
| Variance = 0.6653749999999903 |
This can be interpreted as saying that in order to service all customers with no wait time for any customer, a minimum of six and a maximum of eleven attendants were requires, with a mean of approximately 7.5.
Note the use of write-special to output the history plot (instead of the more convenient printf). This will produce the grapical plot when the output is directed to an editor canvas in MrEd as well as in DrScheme. The (newline) call performs the same function as the ~n in printf.
8.4.3 Closed Loop Processing
Closed loop processing is the "normal" processing mode in a simulation model where the number of units of a unit is specified and processes are queued (i.e., blocked) when there are not sufficient units of a resource to satisfy a request. Statistics on the contention for such resources can be collected by looking at the resource-queue-variable-n variable. Typically, this is done across multiple simulation runs.
8.4.4 Example – Closed Loop Processing
This example collects statistics on the average attendant queue length in the system (a measure of contention) when there is a specified number of attendants.
There is an outer simulation environment rhat exists solely for data collection and a variable avg-queue-length to gather statistics on the average attendant queue length. Note that the statistics must be tallied at this level because (simulated) time does not exist across multiple simulation runs.
The inner loop created a new simulation environment for each simulation rn. This ensures that each run is properly initialized. It is in this inner loop that the attendant resource is created with the specified number of units using (make-resource n-attendants). When the simulation in the inner loop terminates, the avg-queue-length variable (in the outer loop) is updated with the average attendant queue length from the simulation. This is done with:
| (set-variable-value! avg-queue-length |
| (variable-mean |
| (resource-queue-variable-n attendant))) |
Finally, the statistics and histogram of the average attendant queue length across all of the simulation runs is printed.
| #lang scheme/base |
| ; Closed Loop Example |
| (require (planet williams/simulation/simulation-with-graphics)) |
| (require (planet williams/science/random-distributions)) |
| (define n-attendants 2) |
| (define attendant #f) |
| (define-process (generator n) |
| (do ((i 0 (+ i 1))) |
| ((= i n) (void)) |
| (wait (random-exponential 4.0)) |
| (schedule now (customer i)))) |
| (define-process (customer i) |
| (with-resource (attendant) |
| (work (random-flat 2.0 10.0)))) |
| (define (run-simulation n1 n2) |
| (let ((avg-queue-length (make-variable))) |
| (tally (variable-statistics avg-queue-length)) |
| (tally (variable-history avg-queue-length)) |
| (do ((i 1 (+ i 1))) |
| ((> i n1) (void)) |
| (with-new-simulation-environment |
| (set! attendant (make-resource n-attendants)) |
| (schedule (at 0.0) (generator n2)) |
| (start-simulation) |
| (set-variable-value! avg-queue-length |
| (variable-mean (resource-queue-variable-n attendant))))) |
| (printf "--- Closed Loop Example ---~n") |
| (printf "Number of attendants = ~a~n" n-attendants) |
| (printf "Number of experiments = ~a~n" |
| (variable-n avg-queue-length)) |
| (printf "Minimum average queue length = ~a~n" |
| (variable-minimum avg-queue-length)) |
| (printf "Maximum average queue length = ~a~n" |
| (variable-maximum avg-queue-length)) |
| (printf "Mean average queue length = ~a~n" |
| (variable-mean avg-queue-length)) |
| (printf "Variance = ~a~n" |
| (variable-variance avg-queue-length)) |
| (print (history-plot (variable-history avg-queue-length) |
| "Average Queue Length")) |
| (newline))) |
| (run-simulation 1000 1000) |
The following shows the output of the simulation for 1000 runs of 1000 customers each.
| --- Closed Loop Example --- |
| Number of attendants = 2 |
| Number of experiments = 1000 |
| Minimum average queue length = 0.5792057912006373 |
| Maximum average queue length = 3.182757214703683 |
| Mean average queue length = 1.1123279920475524 |
| Variance = 0.08869696318792064 |
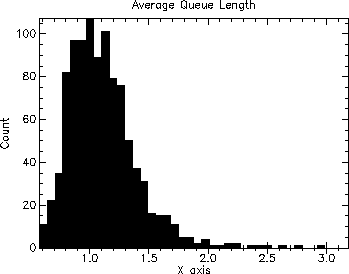
This shows that with two attendants, on average, over 1000 runs of 1000 customers, there were 1.1 people in the queue waiting for an atendant.